Arming You With Metrics to Measure Event ROI
In today’s data-driven climate, phrases such as “numbers don’t lie” or “numbers rule” have gained so much critical currency as to become veritable mottos in business. This is especially true for marketing departments. Numbers in the form of marketing metrics, marketing statistics and benchmarks are de rigueur. Indeed, as marketing departments evolve slowly from traditional marketing through demand generation to reach revenue marketing, marketers are increasingly being held accountable for return on investment– you know, those pesky numbers. How many visitors did we get to our website last month? How many leads did we generate from our new e-book? What is our email campaign CTR rate? What is our CAC ratio and how can we get that number down? These are common questions causing heart rates to increase throughout today’s marketing departments.
However, for event marketers and demand generation specialists who are often responsible for events, a massive segment of department activity that takes up almost 30% of marketing spend, the “numbers” mantra is rapidly morphing into an “Event ROI” mandate. Event marketers and demand generation specialists are now being asked: How many leads did we get from this event? How many will convert into opportunities? How much revenue did we generate? In short, what are the numbers? And where is my credible Event ROI?
But what if you don’t have the numbers? No, seriously. What if you don’t have the data–the raw numbers–to determine your event success? And even if you have marketing automation and event management software in place to collect data, that doesn’t mean your sales, marketing, and executive team have agreed on the metrics you will use to determine event success. What marketers often fail to realize is that successful events always begin with developing realistic and measurable event goals. And because they fail to identify those goals up front, they are often left asking after an event: What’s holding my company back from increasing revenue from events? What did I get out of this big event expenditure?
To help you create realistic and measurable goals and set you up for event success, we’ve compiled a list of 75 Stellar Event Marketing Statistics. These stats will not only help you to develop event goals, but also a tactical plan to meet those goals. We encourage you to leverage these numbers to see exactly (1) where your company measures up in the world of event marketing (2) what you could be doing differently, and (3) what tools can help you turn your events from cost centers to revenue generators.
After reviewing these statistics, you’ll be able to:
- Leverage data on how event apps and event technology boost Event ROI
- Learn how event management software and marketing automation work together to increase your lead generation and sales pipeline
- Discover the latest trends in event sponsorship to help you generate more event revenue
- Uncover which social media platforms are best to leverage for events and the most popular and effective ways to promote your event
In short, these stats provide event marketers and demand generation specialists with benchmarks to gauge where they need to focus their efforts and improve. Once you have these stats in your marketing arsenal, you can use them to improve your event marketing game and achieve event success.
So read on–arm yourself with data that will not only help you rock your next event, but also provide the correct answer when your CMO next asks you: “Okay, what’s our Event ROI?”
Just need a fast statistic? No problem. We’ve also grouped our event marketing stats into useful categories to help you quickly locate the numbers you need:
- Event Marketing Budget Decisions
- Event ROI/ROO
- Event Sponsorship
- Event Platforms & Event Apps
- Social Media Promotion
- In-Person Event Marketing
- Lead Generation
- Event Technology
- Email Marketing Campaigns for Events
- Attendee Engagement & Experience
- Marketing & Event Automation Integration
- Event Promotion
- Direct Mail for Events
- Increasing Sales Pipeline
- Event Follow-up
Event Marketing Budget Decisions
- 83% of B2B marketers are heavily invested in events (Marketing Charts)
- 16.3% of marketers will increase their marketing budget in 2016 (Selligent 2016) Marketing Survey
- 28% of event coordinators say that shows that they participate in will require group decision-making, involving sales, marketing, product development, and senior management buy-in (Exhibitor ROI at Tradeshows)
- 56% of marketers will have an increased budget in 2016 (Selligent 2016 Marketing Survey)
- 63% of event planners base their decision to participate in a tradeshow or convention based on past performance (Exhibitor ROI at Tradeshows)
- 12.8% of marketers will decrease their event spend in 2016 (Selligent 2016 Marketing Survey)
- 14% of B2B marketers’ budgets were allocated for in-person trade shows in 2015 (Statista)
- 45% of event planners say that their budget was their biggest challenge when planning an event (State of Mobile Event Technology Report)
- 59% of B2B companies never charge for their events (Hubspot)
Event ROI/ROO
- 56% of Directors of Marketing view exhibiting positioning on sales floor as most important to maximize ROO/ROI (Exhibitor ROI at Tradeshows)
- Only 34% of marketers use new referrals, quality of leads, deal closure, value of sales, and cross-sell/upsell opportunities to measure event ROI (Marketing Charts)
- 32% of marketers report being dissatisfied with how they can measure Return on Objectives (ROO) (Marketing Profs)
- 44% of marketers experience a 3:1 ROI from event marketing (Statista)
- 70% of marketers say that the most common metric to judge event ROI is amount of media exposure generated (Marketing Profs)
- 22% of brands do not have a way of measuring their events (EventTrack Study)
Event Sponsorship
- 70% of marketers say that the need to validate results from event sponsorship has increased over past 2 years (Marketing Profs)
- 75% of event sponsors are constantly looking for new partnerships (Sponsez)
- Total global sponsorship spending increased 4.1% in 2015 (Sponsorship Spending Report)
- Less than 50% of marketers have a standardized process to measure event sponsorship (Marketing Profs)
- 70% of event sponsorship in North America are for sports-related events Sponsorship Spending Report
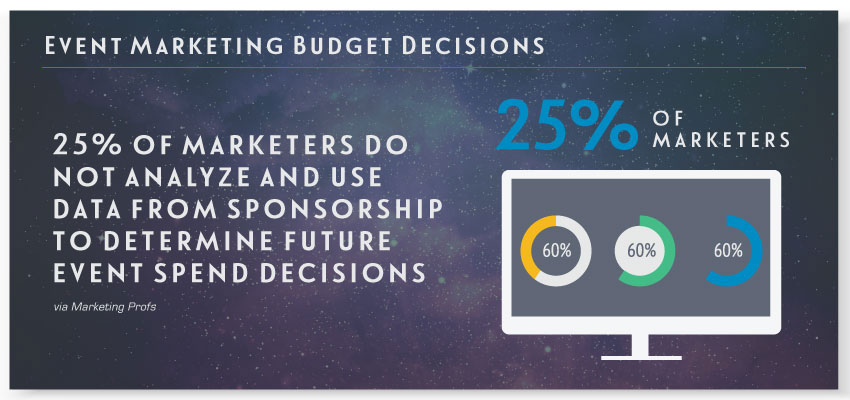
- 25% of marketers do not analyze and use data from sponsorship to determine future event spend decisions (Marketing Profs)
Event Platforms and Event Apps
- 82% of marketers cannot quantify the data received from attendee interactions at their corporate events (Kissmetrics)
- 60% of event planners say that event apps increase attendee engagement (State of Mobile Event Technology Report)
- 88% of event attendees said that access to meeting or event schedules in an event app is extremely important (Marketing Charts)
- 13% of B2B marketers use event marketing software (Capterra)
- 63% of event professionals are not using event apps (The Event App Bible Version 2)
- 22% of marketing departments at B2C companies use event marketing software (Capterra)
- 91% of event planners have seen a positive return on investment from event apps (State of Mobile Event Technology Report)
- 10% of small marketing teams use event marketing software (Capterra)
- 22% of event professionals plan conferences, 21% plan corporate events, and 9% plan tradeshows (The Event App Bible Version 2)
- 19% of enterprise marketers use event marketing software (Capterra)
- 46% of event professionals plan more than 10 events a year (The Event App Bible Version 2)
- The cost of an event app is 1.2% of the budget for each attendee (Global Experience Specialists)
- 60% of smart-phone users are using their devices at social gatherings and events (The Event App Bible Version 2)
- Event app powered events generate 42% more social media impressions (Global Experience Specialists)
- The top 3 special features that event planners look for in an event app are: onsite registration 19%, registration within app 16%, and content capture 15% (Event App Bible Version 2)
- Adoption of event technology increases 35% when an event app and attendee portal are integrated (Global Experience Specialists)
Social Media Promotion
- 61% of event planners use social media to promote their events (Brandon Gaille)
- 59% of event marketers want help in creating or refining a social media marketing strategy (Marketing Charts)
- 61% of event marketers use social media as a promotional tool after their event (EventTrack Study)
- 56% of event marketers use social media to educate prospects and existing customers about their events (Marketing Charts)
- 78% of event professionals plan to increase their use of social media to promote events (Brandon Gaille)
- 35% of event marketers use social media to attract more attendees (Marketing Charts)
- 77% of event marketers use social media to promote before and during their event (EventTrack Study)
- 89% of event marketers use Facebook as their #1 social media tool (Marketing Charts)
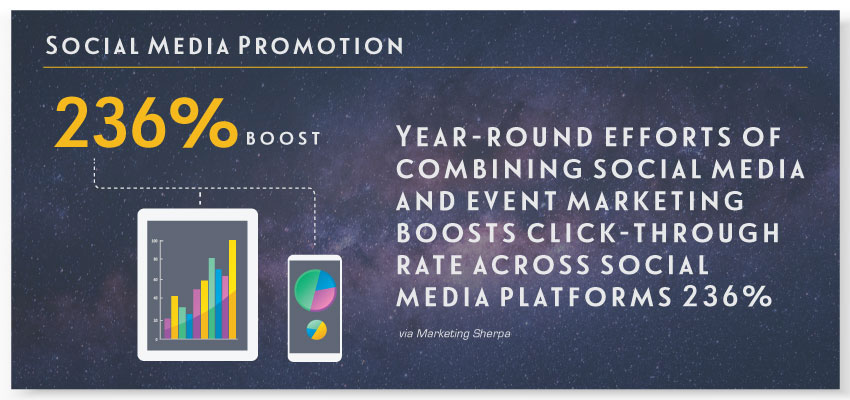
- Year-round efforts of combining social media and event marketing boosts click-through rate across social media platforms 236% (Marketing Sherpa)
In-Person Event Marketing
- 14% of marketers use events to make and close deals (Marketing Charts)
- 84% of consumers repurchase the product promoted at the event, after their first purchase (EventTrack Study)
- 51% of marketers surveyed believe that events strengthen existing customer relationships (Marketing Charts)
- 60% of marketers use tradeshows and events for face-to face customer meetings (Marketing Charts)
- 58% of marketers believe that events and conferences are important ways to improve customer experiences of their services or products (E-Strategy Trends)
- 31% of event marketers believe that trade shows, conferences, conventions, and channel events are essential to doing business in their target customer markets (Marketing Charts)
- 69% of B2B marketers consider in-person events effective (Sensible Marketing)
Lead Generation
- 71% of CMOs believe that tradeshow organizers should be very accountable for audience quality (Exhibitor ROI at Tradeshows)
- 46% of event managers view lead generation as a top reason to attend events (Exhibitor ROI at Tradeshows)
- 64% of marketers use tradeshows and events to source new prospects and business opportunities (Marketing Charts)
- 63% of marketers use tradeshows as a form of lead generation (Marketing Charts)
Event Technology
- 30% of the technology created for events for the last 2 years is live interaction technology (Engaging Events)
- The most used technologies by event planners are photobooths (45%), event apps (44%) and livestreaming tools (44%) (Engaging Events)
- 13.6% of event marketers have no experience using online tools (Hubspot)
- 64% of event planners find it somewhat difficult to secure budget for event technology tools (State of Mobile Event Technology Report)
Email Marketing Campaigns for Events
- 74% of marketers say that email is their most commonly used tool for event promotion (Marketing Charts)
- More than 75% of B2C companies use email marketing to promote their events (Hubspot)
- 50% of event marketers say that getting attendees to respond to their event invites is their largest challenge (Hubspot)
Attendee Engagement and Experience
- 53% of event professionals say that their attendees want greater interaction with speakers at their events (Engaging Events)
- 91% of event professionals stated that increasing engagement at their events was an important priority for their organization (Engaging Events)
- 48% of event attendees find in-person interactions with brands more valuable than 2 years ago (Live Marketing)
Marketing and Event Automation Integration
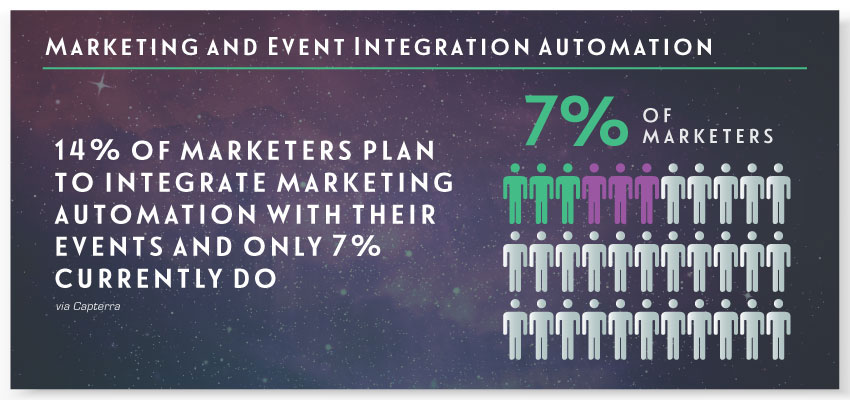
- 14% of marketers plan to integrate marketing automation with their events and only 7% currently do (Capterra)
Event Promotion
- Only 11% of B2C companies use event marketing blogging as a way to promote their events (Hubspot)
- 27% of B2C companies use press releases to promote events (Hubspot)
- The average B2B company spends 5-8 weeks planning an event (Hubspot)
Direct Mail for Events
- 47% of B2C companies use snail mail to send out invites (Hubspot)
Increasing Sales Pipeline
- 83% of brands say that their #1 reason for event participation is increasing sales (Live Marketing)
Event Follow-up
- 75% of leads are never followed-up with after an exhibition (The Marketing Donut)
- 80% of trade show exhibitors don’t follow up with their show leads (salesforce)


