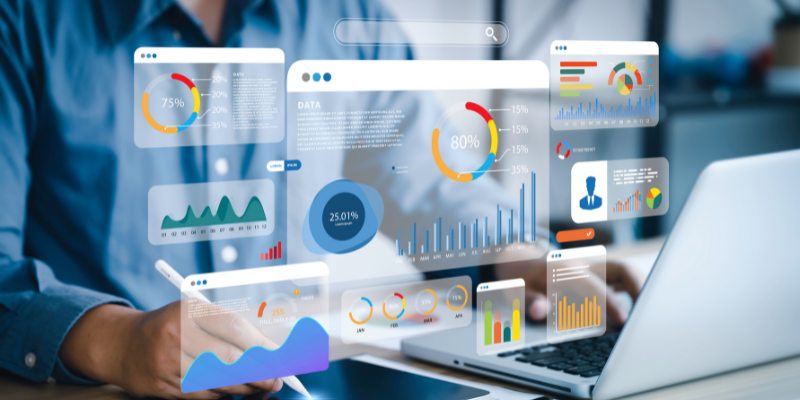
Event Intelligence dashboards can provide valuable insights and data visualization for monitoring and analyzing various aspects of an event. However, not all dashboards are created equal. A competitive event intelligence dashboard is as good as the data that powers it and the types of metrics you are tracking. In this blog, we’ll highlight 10 key elements that you should include in your Event Intelligence dashboard:
1) Revenue & Event ROI Tracking: ROI accountability is on the rise and deserves a dedicated dashboard. It’s incumbent on your event tech provider to not only furnish you with ROI data, but to help you make sense of it by reconciling it with your spend and revenue. Track and analyze the return on investment (ROI) for different event components and evaluate the event’s financial performance.
2) Event Tagging & Categorizing: Especially crucial for event planning teams at large corporations is the ability to tag and categorize events within the platform and have those tags filter your data analysis. Every event intelligence dashboard should include this information. The benefit of looking across an entire event program is dramatically reduced when different event teams in different departments are lumped together and forced to compare apples with oranges.
3) Real-Time Alerts & Metrics: It’s important that you have access to real-time data about your events, such as the number of attendees, registrations, check-ins, and overall event capacity. This gives you an overview of the event’s progress and attendance. Implement an alert system that notifies you of any significant changes or issues in real-time, such as sudden capacity constraints, technical difficulties, or security concerns to ensure a seamless event experience.
4) Attendance Trends: Show attendance trends over time, including hourly or daily attendance figures. This helps identify peak attendance periods and can assist in managing event logistics and resources accordingly. It’s important to know your attendee’s title, location, company, demographic in order to provide a more personalized event experience.
5) Engagement Metrics: Measure attendee engagement through metrics like session ratings, survey responses, social media mentions, and interactions with event apps or platforms. This allows you to assess attendee satisfaction and the success of different sessions or activities.
6) Feedback and Surveys: Include a section displaying feedback and survey responses from attendees. Analyze the feedback to understand attendee preferences, areas of improvement, and overall satisfaction levels.
7) Demographic Analysis: Present demographic data about the attendees, such as age groups, gender distribution, geographic locations, and industry sectors. This information helps identify your target audience and assess the event’s reach and effectiveness in reaching diverse groups.
8) Centralized Data Visualization: Nobody wants to look at their event data in Excel, and few have the skills to transform raw data into intelligible reports anyway. An event intelligence dashboard that lets planning teams visualize the data they need at a glance is now an absolute must-have for a competitive event intelligence dashboard.
9) Advanced Reporting: Event teams have a variety of stakeholders, all of whom are time poor, and each of whom need event reports that speak to their interests and key performance indicators (KPIs). Analytics dashboards today come with smart reporting capabilities that collate event data and convert it into event intelligence at a glance.
10) Historical Data: Event planning teams need to be able to look beyond the event they’re evaluating to see performance in the context of their whole annual program in order to see the larger trend. The numbers for a given event might seem reassuring in isolation, but if previous years’ numbers were even higher, the event might be trending in the wrong direction.
Remember to customize your event intelligence dashboard based on the specific objectives and needs of your event. Additionally, leveraging data visualization techniques like charts, graphs, and heatmaps can make the dashboard more user-friendly and actionable.
Certain Event Intelligence is a highly sophisticated, turn-key solution that will allow you to gather and transform attendee engagement data into important insights at scale. This empowers you to take actions in real-time and deliver meaningful business outcomes. To see how you can take your events to the next level, contact us for a free consultation with one of our event experts.
